<div class="card">
<div class="card-body card-content">
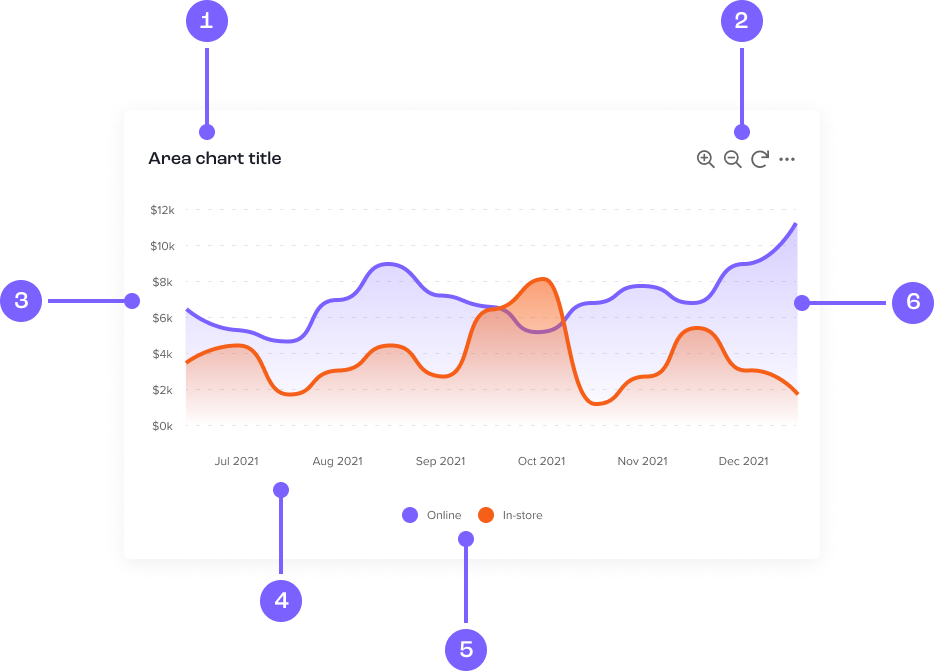
<div id="chart">
</div>
</div>
<div class="card-spinner">
<img class="loading-indicator" src="assets/spinner.png" alt="Loading indicator">
</div>
</div>
<!-- Include link to script below to call ApexCharts -->
<script src="https://cdn.jsdelivr.net/npm/apexcharts"></script>
var options = {
      series: [{
      name: 'series1',
      data: [31, 40, 28, 51, 42, 109, 100]
    }, {
      name: 'series2',
      data: [11, 32, 45, 32, 34, 52, 41]
    }],
      chart: {
      height: 400,
      type: 'area',
      toolbar:{
        tools: {
          download: '<svg
										xmlns="http://www.w3.org/2000/svg" viewBox="0 0 448 512"><path d="M336 256C336 229.5 357.5 208 384 208C410.5 208 432 229.5 432 256C432 282.5 410.5 304 384 304C357.5 304 336 282.5 336 256zM176 256C176 229.5 197.5 208 224 208C250.5 208 272 229.5 272 256C272 282.5 250.5 304 224 304C197.5 304 176 282.5 176 256zM112 256C112 282.5 90.51 304 64 304C37.49 304 16 282.5 16 256C16 229.5 37.49 208 64 208C90.51 208 112 229.5 112 256z"/></svg>',
          reset: '<svg
										xmlns="http://www.w3.org/2000/svg" viewBox="0 0 512 512"><path d="M496 40v160C496 213.3 485.3 224 472 224h-160C298.8 224 288 213.3 288 200s10.75-24 24-24h100.5C382.8 118.3 322.5 80 256 80C158.1 80 80 158.1 80 256s78.97 176 176 176c41.09 0 81.09-14.47 112.6-40.75c10.16-8.5 25.31-7.156 33.81 3.062c8.5 10.19 7.125 25.31-3.062 33.81c-40.16 33.44-91.17 51.77-143.5 51.77C132.4 479.9 32 379.5 32 256s100.4-223.9 223.9-223.9c79.85 0 152.4 43.46 192.1 109.1V40c0-13.25 10.75-24 24-24S496 26.75 496 40z"/></svg>',
          zoom: false,
          zoomin: '<svg
										xmlns="http://www.w3.org/2000/svg" viewBox="0 0 512 512"><path d="M504.1 471l-134-134C399.1 301.5 416 256.8 416 208C416 93.13 322.9 0 208 0S0 93.13 0 208S93.13 416 208 416c48.79 0 93.55-16.91 129-45.04l134 134C475.7 509.7 481.9 512 488 512s12.28-2.344 16.97-7.031C514.3 495.6 514.3 480.4 504.1 471zM208 368c-88.22 0-160-71.78-160-160s71.78-160 160-160s160 71.78 160 160S296.2 368 208 368zM288 184H231.1V128c0-13.26-10.74-24-23.1-24S184 114.7 184 128v56H127.1C114.7 184 104 194.7 104 208s10.73 24 23.1 24H184V288c0 13.26 10.73 24 23.1 24c13.26 0 23.1-10.74 23.1-24V232h56C301.3 232 312 221.3 312 208S301.3 184 288 184z"/></svg>',
          zoomout: '<svg
										xmlns="http://www.w3.org/2000/svg" viewBox="0 0 512 512"><path d="M504.1 471l-134-134C399.1 301.5 416 256.8 416 208C416 93.13 322.9 0 208 0S0 93.13 0 208S93.13 416 208 416c48.79 0 93.55-16.91 129-45.04l134 134C475.7 509.7 481.9 512 488 512s12.28-2.344 16.97-7.031C514.3 495.6 514.3 480.4 504.1 471zM208 368c-88.22 0-160-71.78-160-160s71.78-160 160-160s160 71.78 160 160S296.2 368 208 368zM288 184H127.1C114.7 184 104 194.7 104 208s10.73 24 23.1 24h160C301.3 232 312 221.3 312 208S301.3 184 288 184z"/></svg>',
          pan: false
        },
      },
    },
    dataLabels: {
      enabled: false
    },
    stroke: {
      curve: 'smooth'
    },
    xaxis: {
      type: 'datetime',
      categories: ["2018-09-19T00:00:00.000Z", "2018-09-19T01:30:00.000Z", "2018-09-19T02:30:00.000Z", "2018-09-19T03:30:00.000Z", "2018-09-19T04:30:00.000Z", "2018-09-19T05:30:00.000Z", "2018-09-19T06:30:00.000Z"]
    },
    tooltip: {
      x: {
        format: 'dd/MM/yy HH:mm'
      },
    },
    title: {
      text: 'Example title'
    },
    colors: ['#7B61FF', '#F65F18']
    };

    var chart = new ApexCharts(document.querySelector("#chart"), options);
    chart.render();